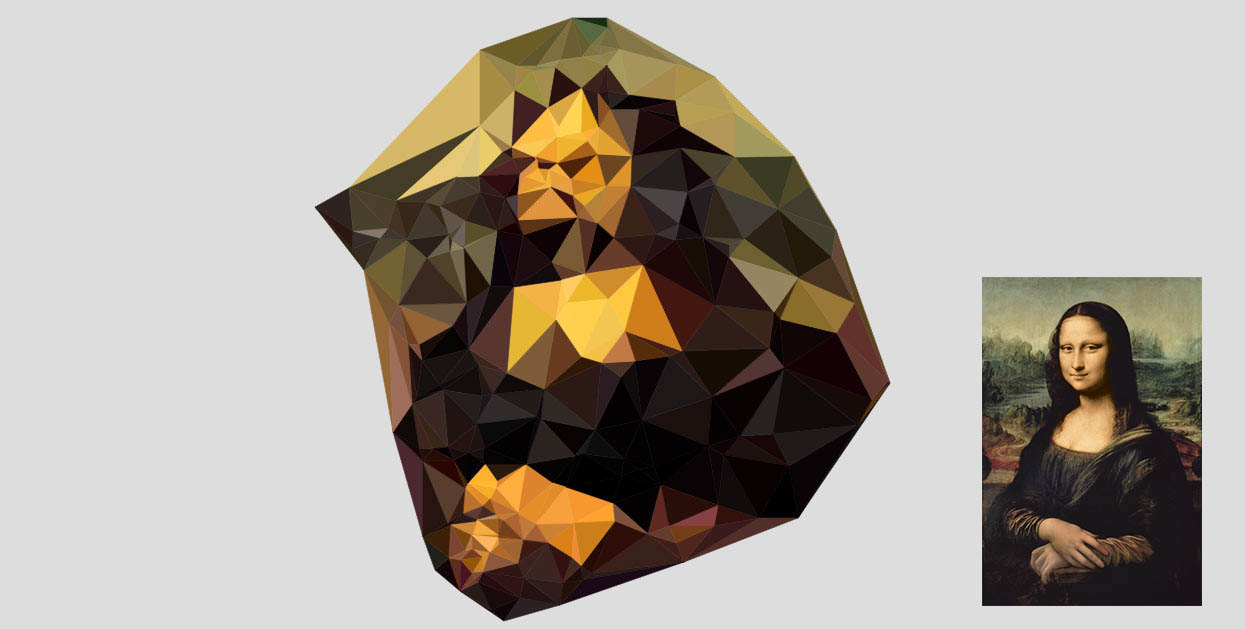
Here is one of my creations, the Poly Maker 2D tool. While it may not have any significant impact or improve anyone's daily life, the process of creating it was enjoyable and fulfilling. I was inspired by Paul Lewis' original Poly Maker tool, which was written using JavaScripts and WebGL and which is not available now :(. I decided to take on the challenge and build my own real-time version using Python and PyQt. Feel free to fork, modify, or enhance the code as you see fit.
Bezier curve
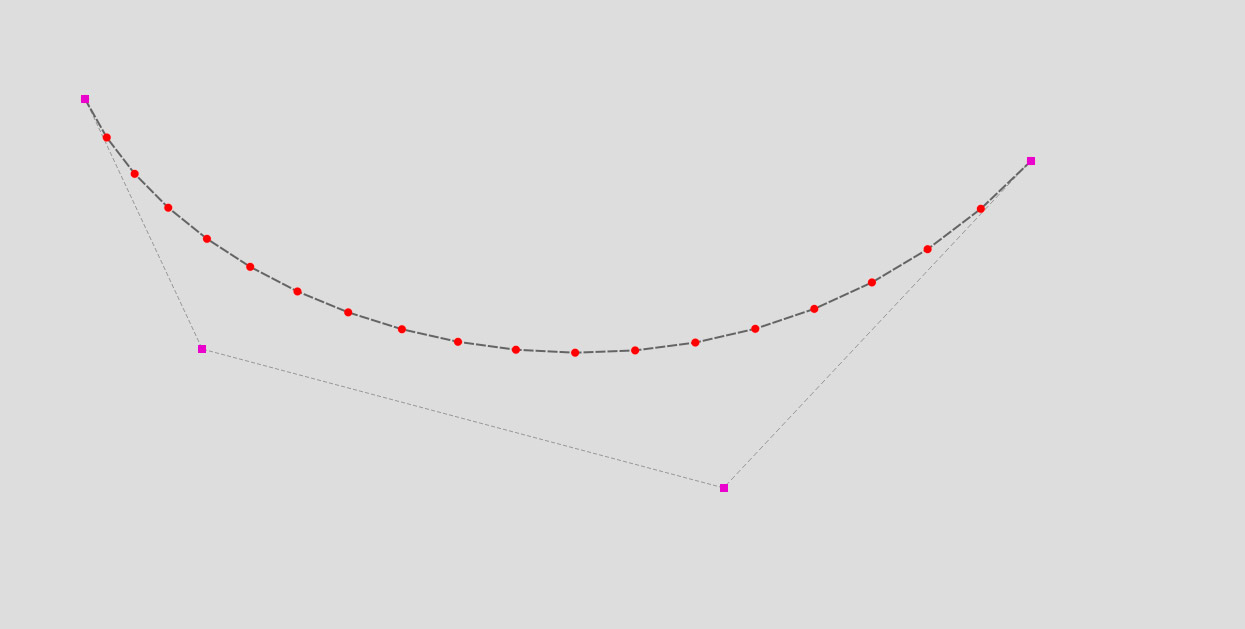
In computer graphics, a Bezier curve is a powerful tool for creating procedural shapes. It works by using entry data, such as starting points, to calculate all the in-between points. To get started, I placed 4 points manually on the canvas. There are various ways to create a Bezier curve, but I went with a cubic one, which requires a minimum of 4 points to define the curve and passes through the first and last points. For a more in-depth explanation of Bezier curves, you can check out this resource. But if you want to save your time, the equations to calculate the coordinates of a Bezier curve points are presented below.


The following code is a Python implementation of these equations:
import math

def binomial(i, n):
    """Binomial coefficient"""
    return math.factorial(n) / float(math.factorial(i) * math.factorial(n - i))

def bernstein(t, i, n):
    """Bernstein basis polynomial"""
    return binomial(i, n) * (t ** i) * ((1 - t) ** (n - i))

def bezier(t, points):
    """Per each iteration calculate curve point coordinates"""
    n = len(points) - 1
    x = 0
    y = 0
    for i, pos in enumerate(points):
        b = bernstein(t, i, n)
        x += pos[0] * b
        y += pos[1] * b

    return round(x,4), round(y,4)

def bezierCurve(n, points):
    """Bezier curve points generator"""
    for i in range(n):
        t = i / float(n - 1)
        yield bezier(t, points)
Grid points
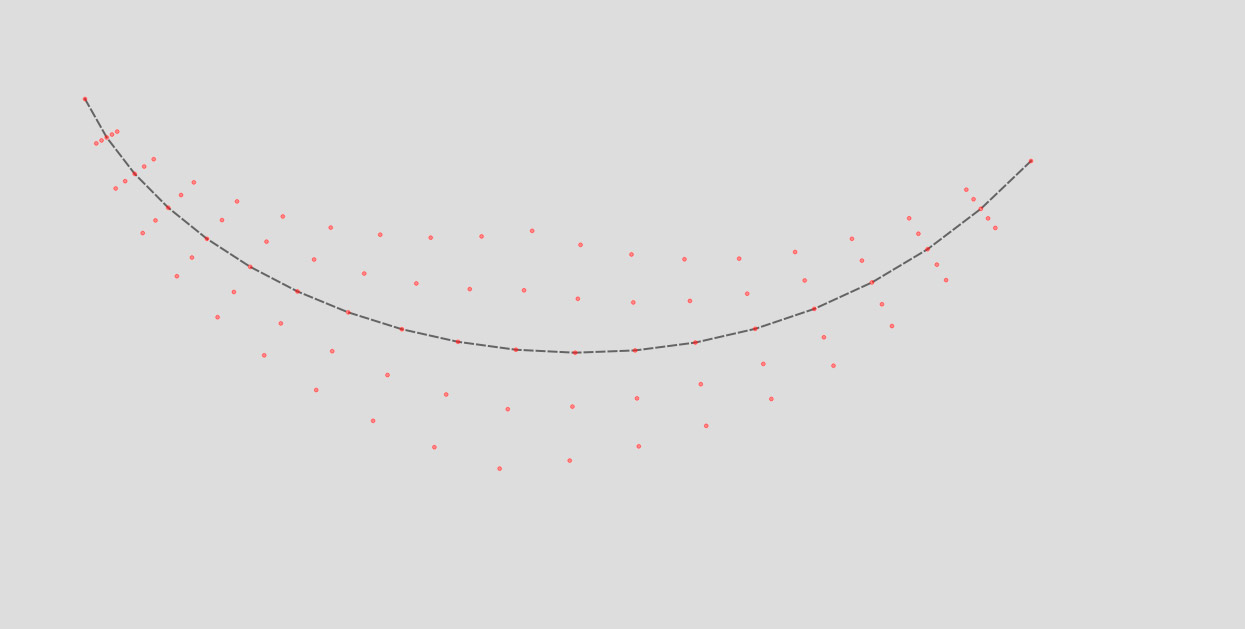
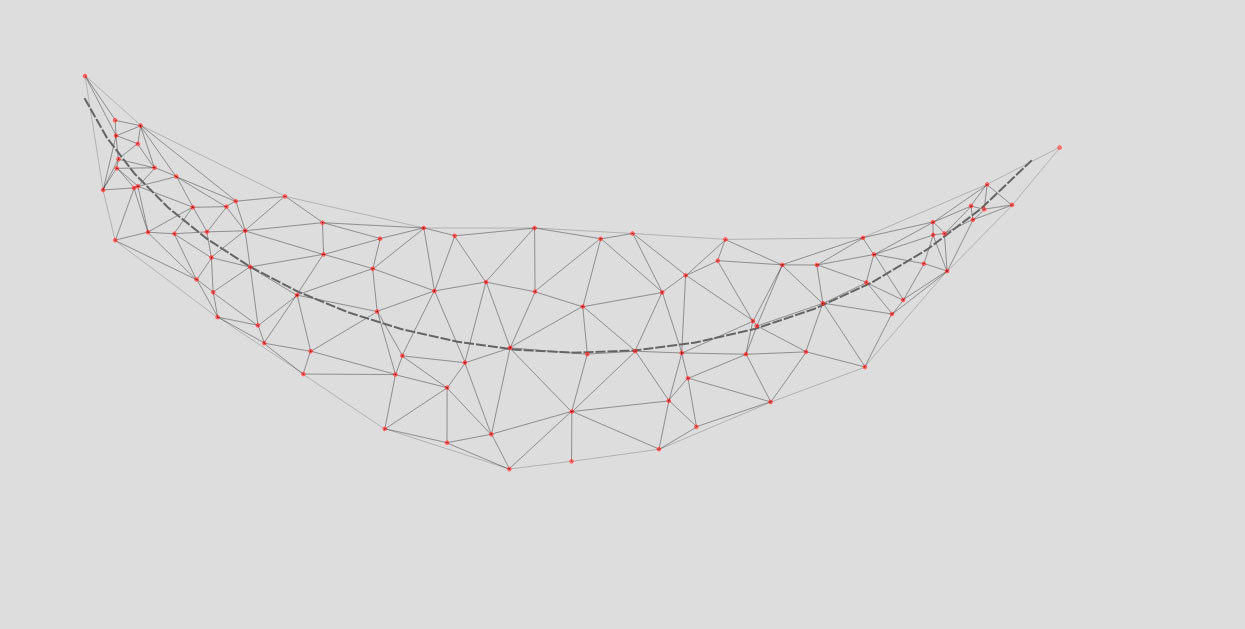
Before generating polygons along the curve, we generate a set of points placed along the curve normals. This step is crucial as it establishes a grid of points that will serve as the foundation for our Delaunay triangulation algorithm. The tool works in real-time, allowing for dynamic adjustments to be made. Whenever we move a control point (represented by pink squares), all the grid points are recalculated. This is where linear algebra comes into play. To find normal vectors in each segment point of our Bezier curve, I calculated a cross-product of Tangent vectors (the lines between points) and Up vector [0,0,1]. The resulting vectors were normalized. Then I generated points along the normals (on both sides of the curve), with points closer to the centre of our curve being shifted more than the points closer to the curve ends.
Delauney triangulation
In order to connect points into triangles I used matplotlib module that has everything we need to calculate a set of triangles using the given set of points. It uses Delauney triangulation algorithm and works pretty fast.
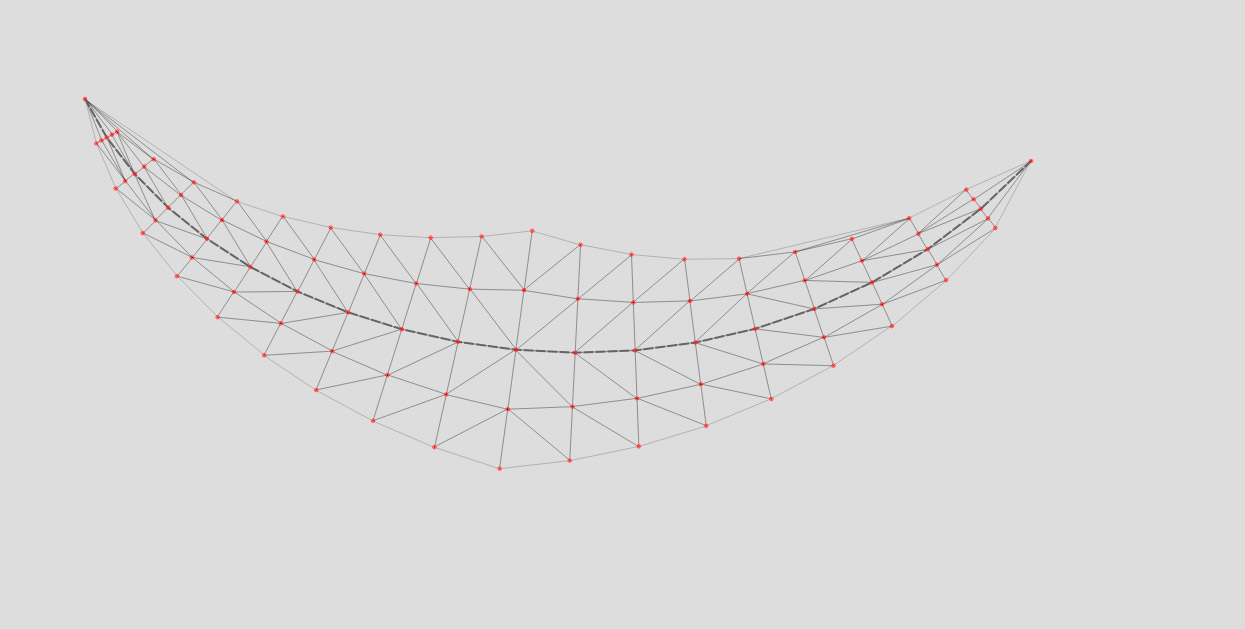
But it's not exactly what I want. So I added a jitter effect in order to move points using some random directions and offsets.
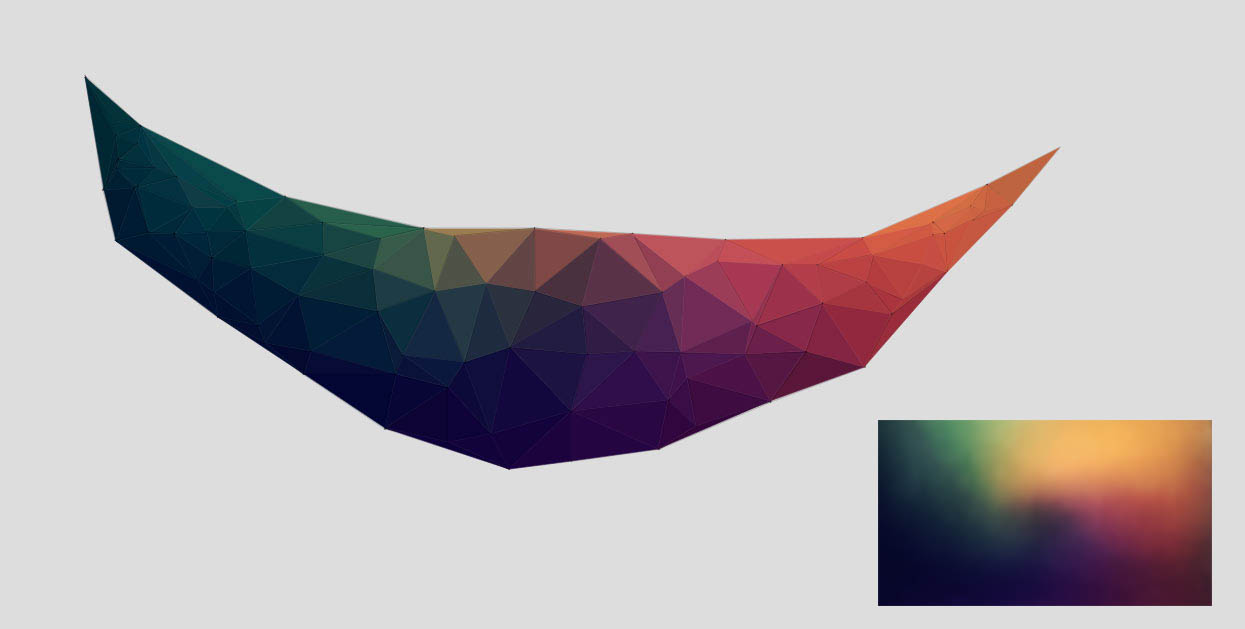
Coloring the polygons
For coloring the polygons the first thing I did was adding some color gradient based on the Y coordinates of each triangle's centroid. It worked but I wanted something more advanced like grabbing colors from a random image. So I googled some samples and found a few interesting ones. In order to be able to recalculate triangles colors when I move my control points I decided to use a QPixmap and QImage classes. First thing I did was calculating the width and the height of my lowpoly mesh and resize a given image so it's size could match the size of the mesh. Next thing was mapping triangles centroids coordinates to the image so I could grab a pixel color. Then I used this color as a brush color for painting polygons. And it worked. If you run the project and set any image - you will see how colors of the polygons are changing when we move Control Points.
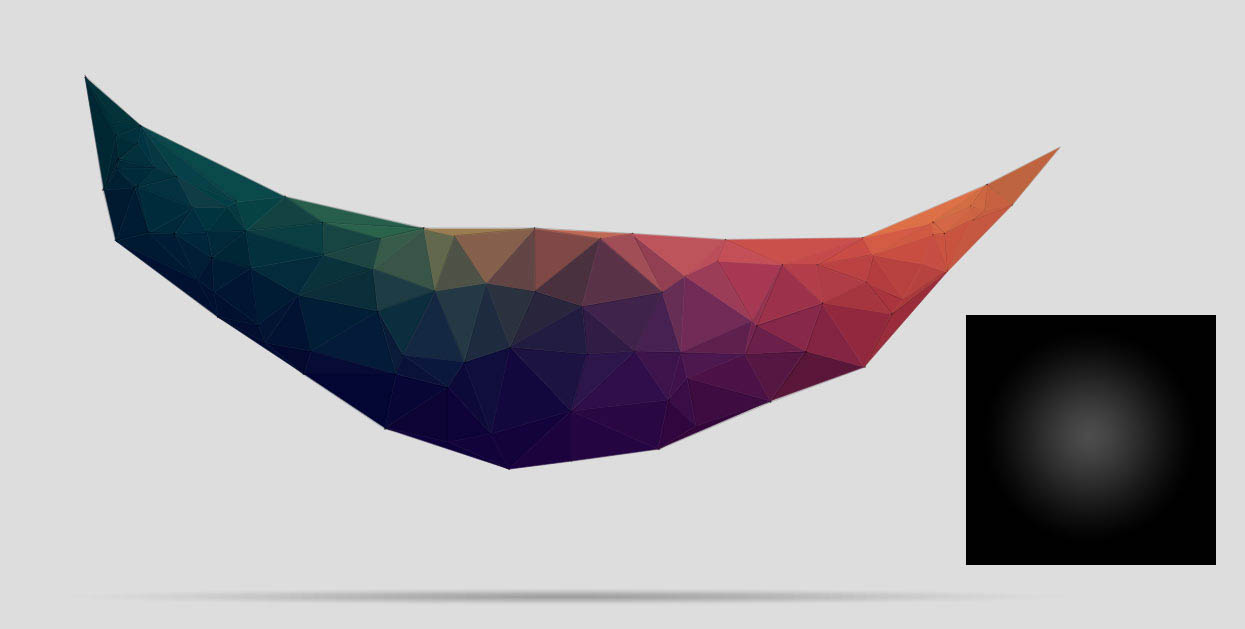
Adding shadow didn't take too much time as it was similar to the coloring procedure. I've just calculated the width of the lowpoly mesh and resized my QGraphicsPixmapItem object that keeps a reference to the shadow image file. The height of the shadow is fixed and positioned at the fixed Y position.
Using another sample image